
Interlinking stakeholders
We bring professionals, institutions, county leaders, industry and communities into the same conversation about energy. We convene and connect — the mandated agencies lead their own work.
Nuclear Energy is the Better
NUeB Kenya interlinks professionals, institutions, industry and the public around the peaceful use of nuclear science — through awareness, information sessions and open knowledge.
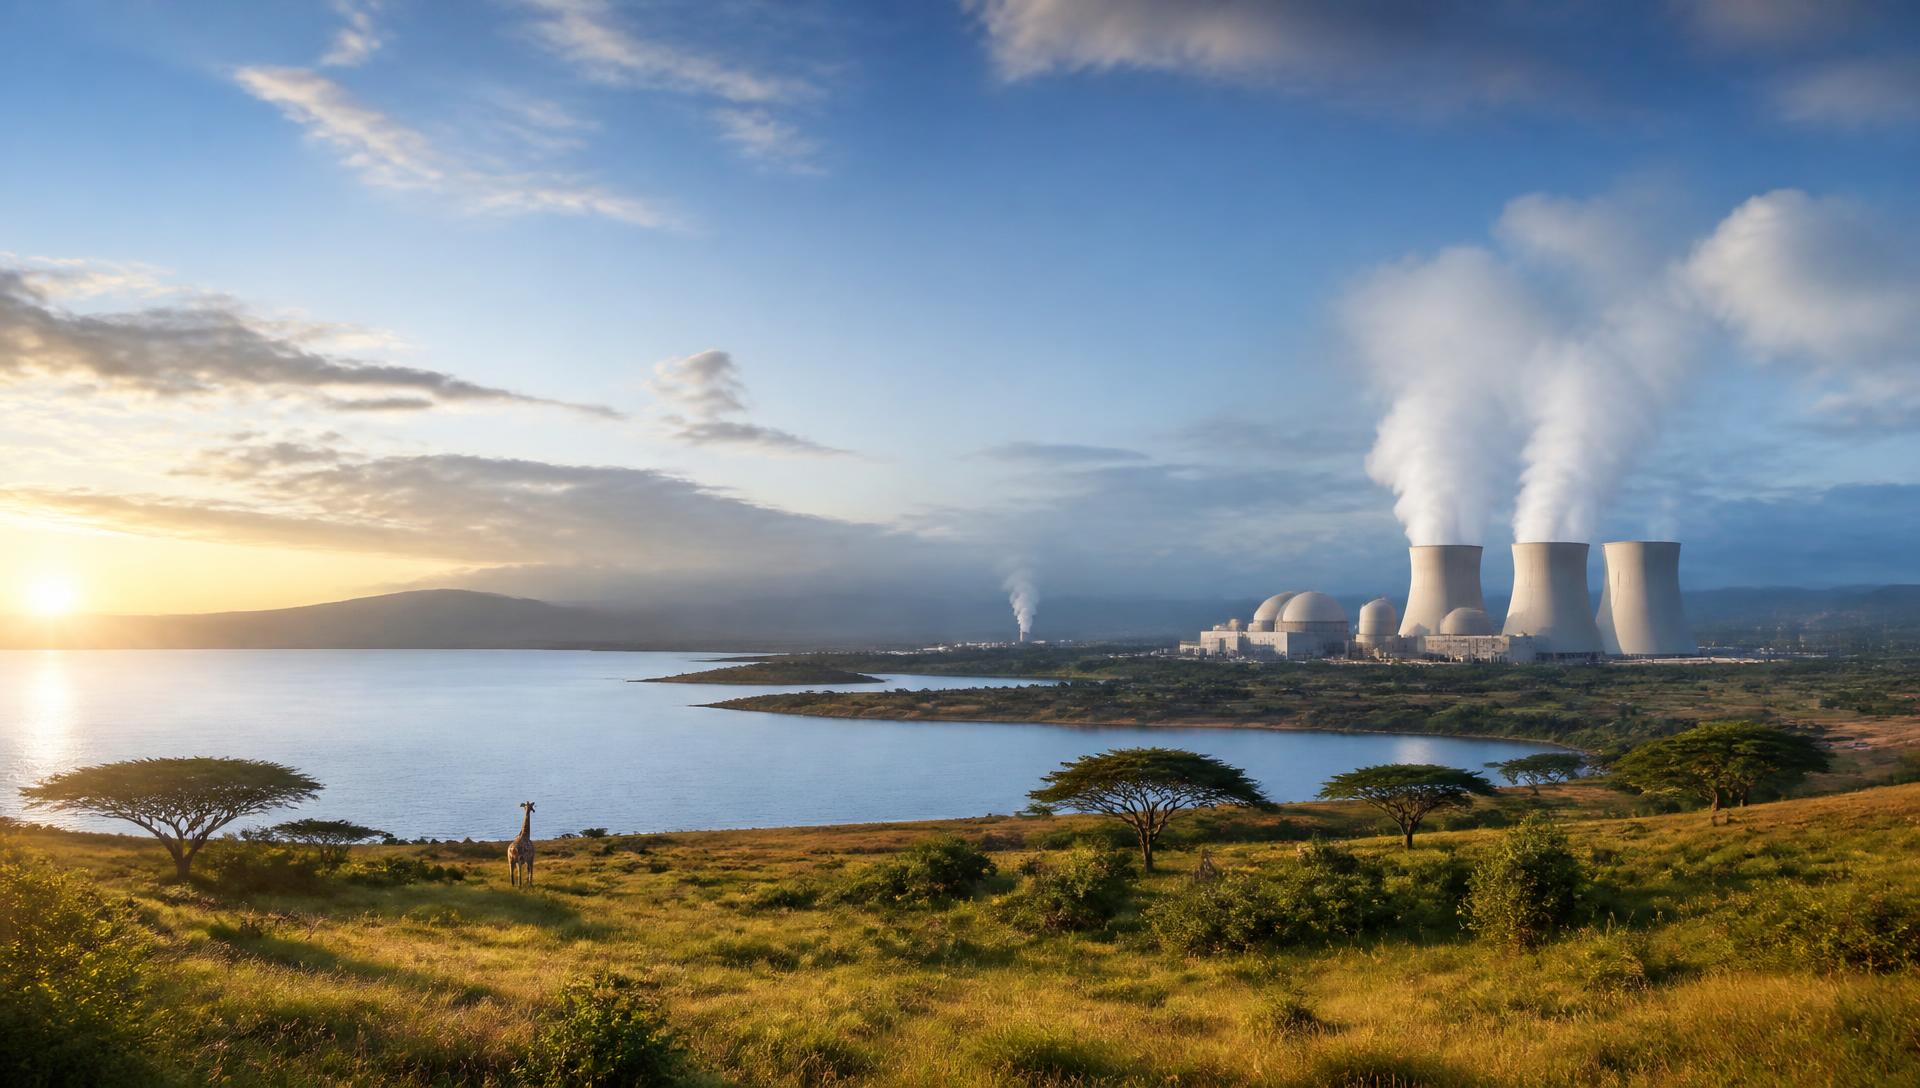
What NUeB means
NUeB means, generally, Nuclear Energy is the Better energy — period. All energy sources have their trade-offs, and that does not mean they cannot be used to advance national and regional development.
Energy in focus
Clear, accessible views of the costs, fuels, trade-offs and responsibilities that shape Kenya's energy future.
What we do
We are a bridge, not an operator. Kenya's nuclear programme is led by its mandated public institutions; our work is to interlink people around it and keep the public informed.
We bring professionals, institutions, county leaders, industry and communities into the same conversation about energy. We convene and connect — the mandated agencies lead their own work.
Public campaigns, information sessions and plain-language explainers so that Kenyans can judge nuclear energy on evidence rather than on rumour.
Nuclear is a low-carbon, land-light, climate-friendly source. We make the environmental case openly and share the facts behind it.
Climate & environment
Kenya already runs one of the greenest grids in the world. Nuclear complements geothermal, hydro, wind and solar with round-the-clock, carbon-free electricity — and it does so on a remarkably small environmental footprint.
~12 gCO₂e/kWh
Lifecycle emissions of nuclear electricity — on par with wind and lower than solar PV (IPCC median).
~1/300th the land
Land needed per unit of electricity compared with the same output from ground-mounted solar.
24/7 clean power
Nuclear runs day and night, letting solar, wind, hydro and geothermal do more, not less.
60–80 years
Operating life of a modern reactor — clean generations of electricity from one build.
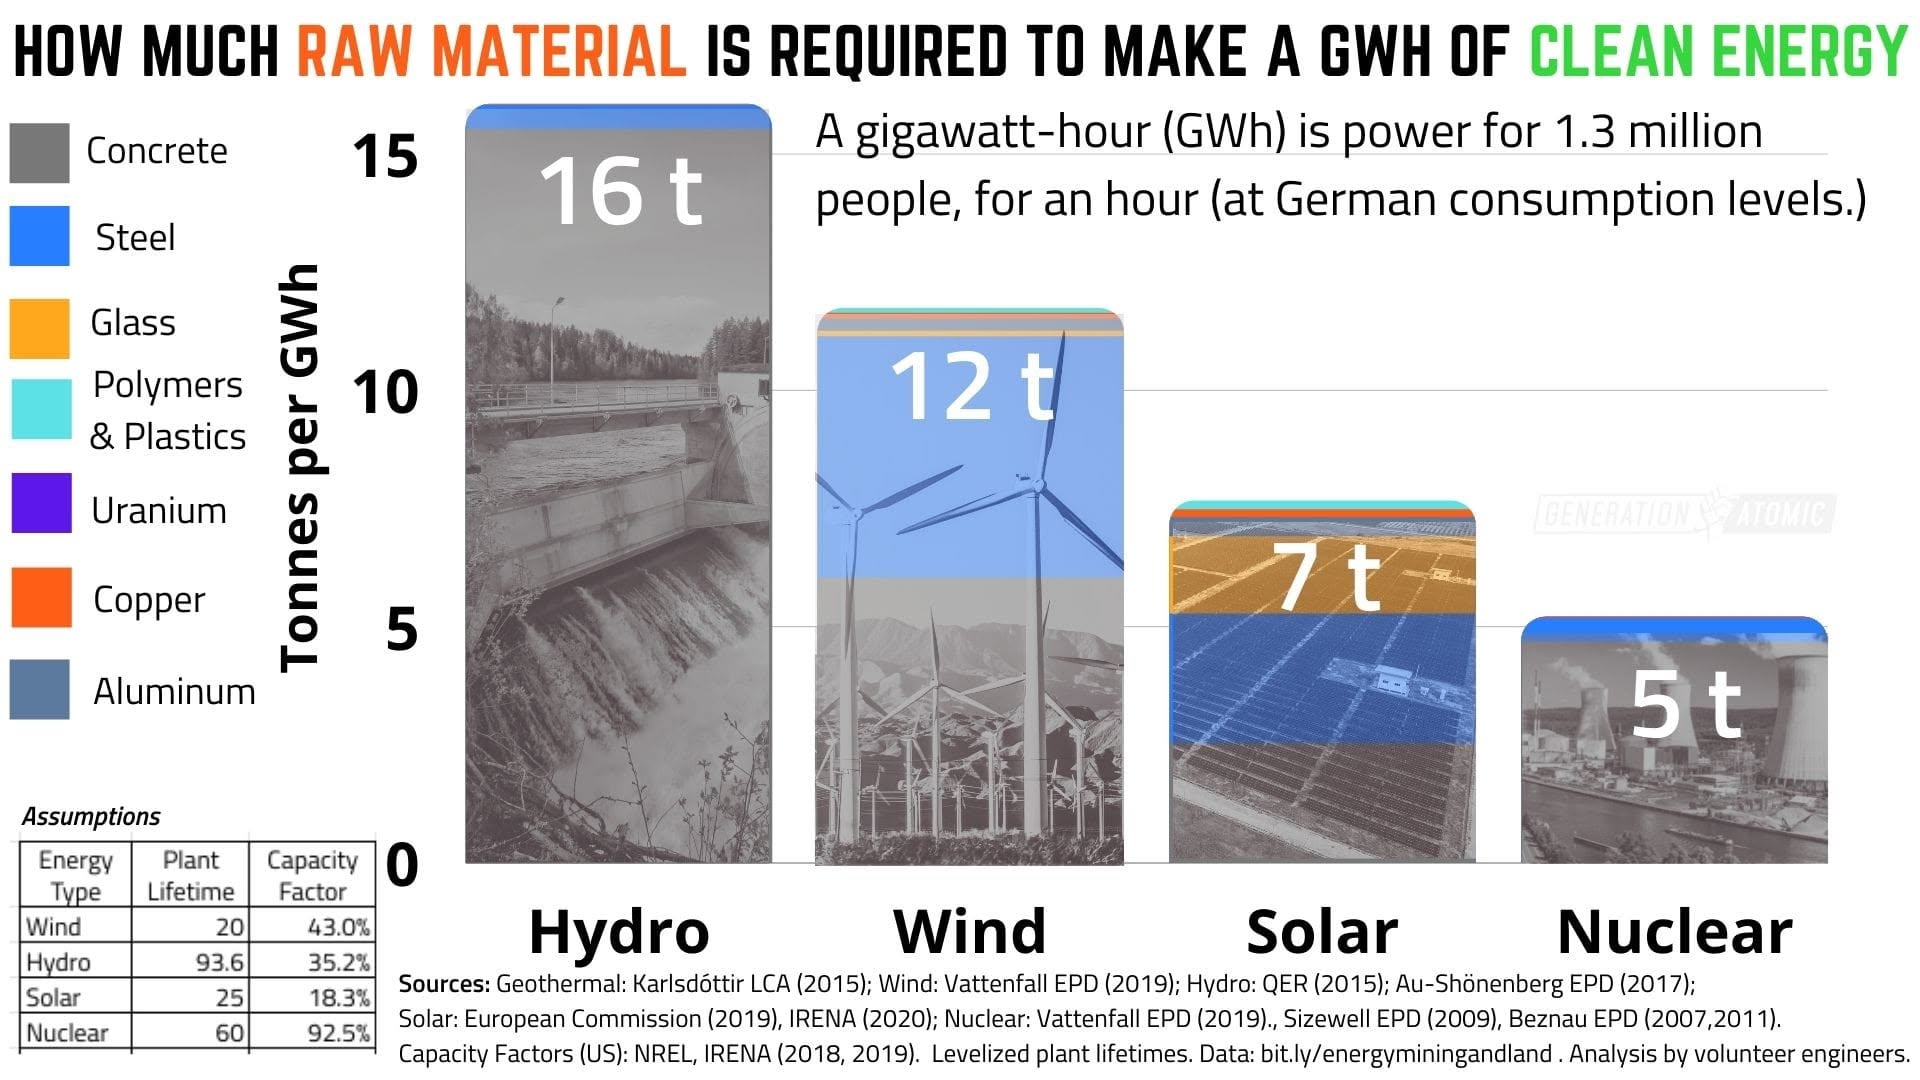
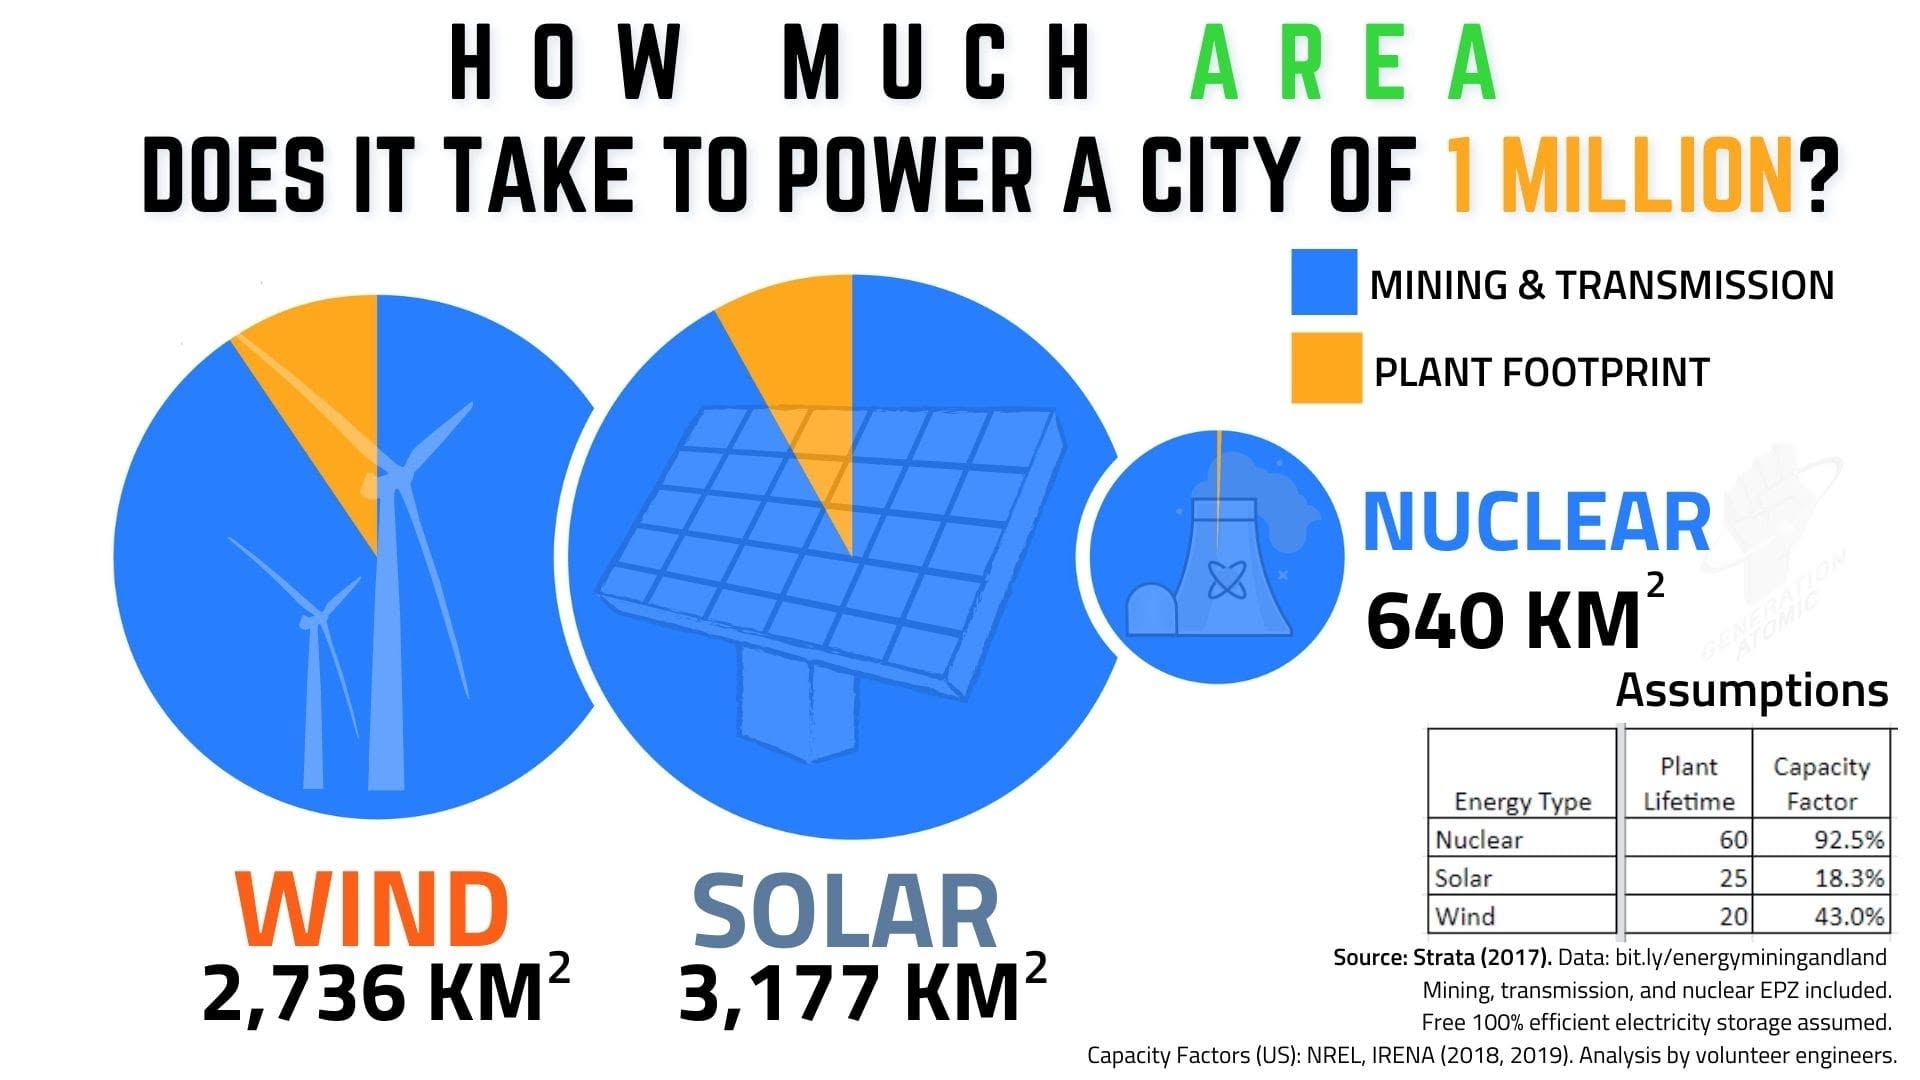
Carbon emissions
The ozone layer
The atmosphere is a blanket of gases in layers — the troposphere, stratosphere, mesosphere, thermosphere and exosphere. Ozone (O₃) rests in the stratosphere, where it shields the earth from harmful ultraviolet radiation from the sun.
Human damage comes from chlorine and bromine reaching the ozone and reacting with it. These ozone-depleting substances (ODS) include chlorofluorocarbons (CF₂Cl₂), halons (CF₃Br), carbon tetrachloride (CCl₄), methyl chloroform (C₂H₃Cl₃), hydrochlorofluorocarbons (C₂H₃Cl₂F) and methyl bromide (CH₃Br).
Rampant depletion brings health consequences including cancer, alongside impacts on agriculture, forestry and marine life.
1985 — Vienna Convention
The international treaty on the protection of the ozone layer.
1987 — Montreal Protocol
Set out to repair and protect the ozone layer by phasing out production and consumption of ODS for end applications.
Latest
Open knowledge from the conversation about Africa's energy future.
The Kenyan statutes, institutions and international treaties that govern nuclear energy — and who is responsible for what.
Read the framework →What smaller, factory-built reactors could mean for industry, water and regional power sharing.
Read on the Atomic African blog →An open webinar on treaties, safety and the peaceful use of the atom. Free to attend, questions welcome.
See the schedule →Our position
Whether you are a professional with expertise to share, a student, a journalist, a county leader or simply a curious Kenyan — the conversation is open to you. We work strictly within the peaceful-use framework and alongside, never in place of, the country's mandated energy and regulatory bodies.